The Summaries Panel displays the a topology of the services in the Pyramid cluster including high level diagnostic data. It also includes a summary of the current licensing, pulse nodes, and tasks status.
Diagnostics Panel
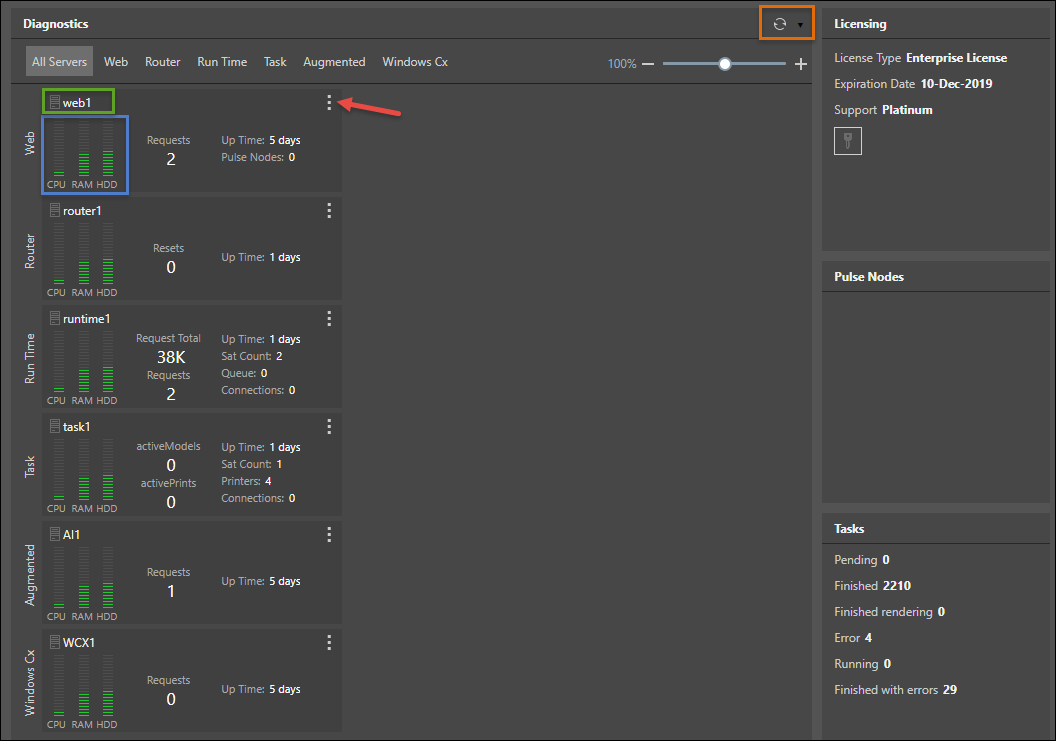
The Diagnostics interface presents all the system's servers and their usage. You can display All Servers (as in the above image), or click on the required server. Click on the server again to hide it. A separate box will be shown for each node.
Quick Buttons
Click the refresh button (orange highlight above) to refresh the data from the diagnostics data. From the refresh drop down, select the required refresh schedule. By default the schedule is set to 'Every 30 Seconds'. If you don't want a scheduled refresh, select 'None'.
Lights will be shown in the quick button area if you have certain settings on that can degrade system performance. Hover over the lights to see the issues:
- red: certain logging settings have been enabled and should be turned off.
- yellow: certain settings have been enabled and are recommended to be turned off
Other icons may be shown with details of the system database repository and a count of running tasks on the system.
Server Panels
Resource Usage
Each server panel displays resource usage (blue highlight), measured from 0% - 100%:
- CPU: displays green if CPU usage is 85% or less, yellow if it's 86% - 90%, and red if it's 91% or above.
- Memory: displays green if memory usage is 85% or less, yellow if it's 86% - 90%, and red if it's 91% or above.
- Disk: displays green if hard disk drive usage is 60% or less, yellow if it's 61% - 80%, and red if it's 81% or above.
System Resource Warnings
The system can auto email / SMS enterprise admins if and when any resource levels are determined to be critically high (red). This option to enable this can be found under networking and requires email and/or phone messaging to be enabled.
Indicators
Depending on the service type, high level indicators are provided
- Active Models: the number of data models currently being processed or scheduled to be processed.
- Active Prints: the number of print jobs currently being processed or scheduled to be processed.
- Connections: the number of active connections against the repository database.
- Printers: the number of printers currently connected to the task engine server.
- Pulse Nodes: number of pulse nodes.
- Queue: the number of requests that are waiting to be processed.
- Requests: the number of current active requests.
- Request Total: the total number of requests that have been sent to the Run Time server during the current up time.
- Resets: number of times the server has been reset.
- Sat Count: number of satellite servers running.
- Up Time: the time since the server was last reset.
Server Actions
Click the server panel's context menu (red arrow) to access several actions for each node:
- Rename the server panel; this is the description at the top of the panel (green highlight).
- Restart the server: this will recycle the service on the host machine. BEWARE: This may render the cluster inoperable until it is restored.
- Reload configuration; this will instruct the service to reload its stored configuration from the database to flush / refresh its settings. BEWARE: this may render the cluster inoperable until its restored.
- Set Memory Limit: this will provide a dialog allowing admins to change the upper memory limit (measures in Mega Bytes) for the selected service. Click here for more details.
Peripheral Panels
Licensing
Displays a summary of the currently loaded including type, license expiration date, and support level. Click the key button to go to the Licensing panel.
Pulse Nodes
Displays details about currently operating Pulse nodes for off-network data access.
Tasks
Displays a summary of batch operations and tasks, all finished tasks, all rendered tasks, all errors, currently running tasks, and all tasks finished with errors. Most of these can be seen and managed in the Schedules section.